Core Tutorials
Examples
Advanced
Using Conformal Maps to Find Equipotentials and Field Lines
Note, this relies heavily on the notes from Randy Johnson’s E&M lectures
Let’s start with a uniform electric field in the y direction, of strength and potential at . The equation for the potential at any point (y) will then be
Now, we want to use a conformal map to see what the field lines and equipotential lines look like for a similar situation, but with the sides of a plate at an angle to one another.
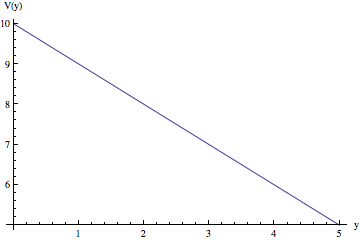
First, let’s draw the picture of the potential as a function of y:
V[y_] = V0 - E0 y

Plot[V[y] /. {V0 -> 10, E0 -> 1}, {y, 0, 5}, AxesLabel -> {"y", "V(y)"}]

Now, we can describe the entire problem in the complex plane, by shifting from to
f[z_, V0_, E0_, \[Beta]_] := I V0 - E0 z
And we will use the conformal map from the g plane to the z plane
The inverse is then
and we simply plug this into our to get the transform.
f[z^(\[Pi]/\[Beta]), v0, e0, \[Beta]]

I V0 - E0 z^(\[Pi]/\[Beta])
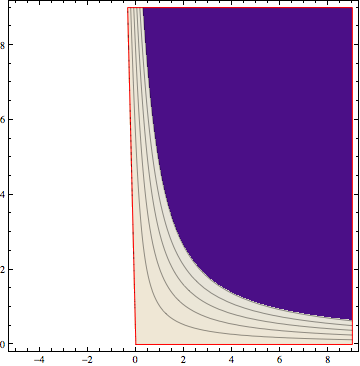
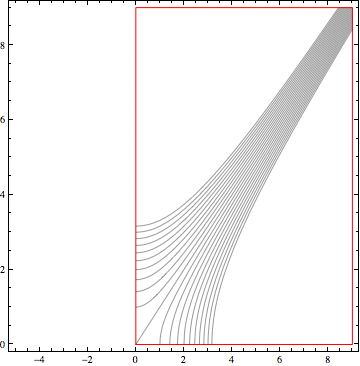
The equipotentials are given by the imaginary part of this, and the field lines by the real part. Let’s manipulate the plot to make sure we get physical results.
Be sure to play with the slider!
Im[f[z^(\[Pi]/\[Beta]), v0, e0, \[Beta]]]
 -Im[e0 z^(\[Pi]/\[Beta])] + Re[v0]

Re[f[z^(\[Pi]/\[Beta]), v0, e0, \[Beta]]]
 -Im[v0] - Re[e0 z^(\[Pi]/\[Beta])]

g1 = Manipulate[
  ContourPlot [{-Im[(x + I y)^(\[Pi]/\[Beta])] + Re[10]}, {x, -5,
    9}, {y, 0, 9}, AspectRatio -> 1, Contours -> {10, 8, 6, 4, 2, 0},
   RegionFunction ->
    Function[{x, y}, Im[(x + I y)^(\[Pi]/\[Beta])] >= 0 && y >= 0],
   BoundaryStyle -> Red], {\[Beta], \[Pi], 0}]

g2 = Manipulate[
  ContourPlot [-Im[10] - Re[ (x + I y)^(\[Pi]/\[Beta])], {x, -5,
    9}, {y, 0, 9}, AspectRatio -> 1, ContourShading -> False,
   Contours -> Range[-10, 10, 1],
   RegionFunction ->
    Function[{x, y}, Im[(x + I y)^(\[Pi]/\[Beta])] >= 0 && y >= 0],
   BoundaryStyle -> Red], {\[Beta], \[Pi], 0}]

*AD